MICRORAD PRODUCT LINE
Meters
• NHT 3DL reference meter for EU Directive 2013/35/EU
• NHT 3D Complex Signals Analyzer 0Hz–40GHz
• NHT 310 Broadband EM Field Meter: 0Hz–40GHz
• NHT 310 F for 5G and Radar Signals
Probes
• Probe Matrix by Frequency for Magnetic and Electric Fields
• New ER Family of Radar Probes!
• EMF18-G Sensor for EMC applications
Software
Competitive Advantages
Application Sectors / Target Markets
RELIANT EMC PRODUCT LINES
MANUFACTURERS
Request a Quote / Contact Us!
MICRORAD SOFTWARE
MICRORAD OFFERS 3 SOFTWARE PACKAGES FOR THEIR METERS AND SENSORS
• Waves Software for the NHT 3D meter
• MicroLink Software for the NHT 310 meter
• EMC Viewer Software displays data from 8 Sensors Simultaneously
WAVES SOFTWARE FOR THE NHT ED METER
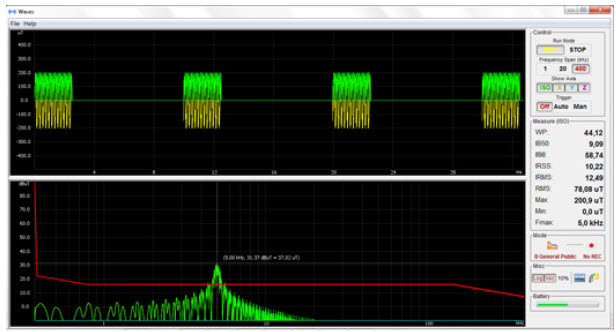
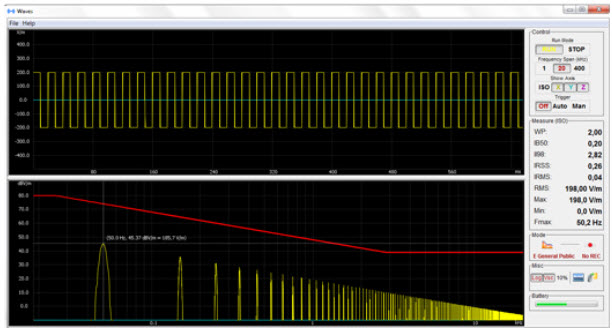
Microrad Waves is a software application which allows the user to interact with the NHT 3D meter. The Waves application allows the operator to perform domain analysis and frequency measurements in both real time and in post processing mode using data recorded during monitoring. Waves is easy to use, modern (state of the art) and intuitive. It interfaces with the NHT 3D meter to provide an optimal measuring device. This software application provides the operator with an integrated system capable of performing fully automated analysis in the time and frequency domain of ELF complex signals. The application is suitable for analyzing complex and pulse signals in conjunction with a PC / Tablet connected via fiber optic (through a converter Optical / USB).
Main functions:
- Marker and simultaneous reading Amplitude/Time/Frequency
- Zoom and Pan
- Masks selectable according to the reference Standard
- Manual or Automatic trigger
- Simultaneous calculation of the indexes: WP10, II98, IB50, IRSS
- Suppression of spectral contributions according to the standard EN 50 500
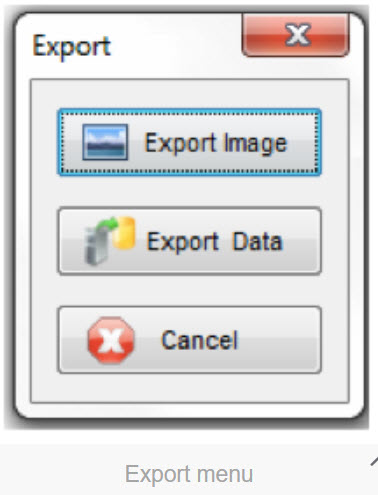
All the displayed information can be exported as image or data. Waves can be installed on systems running Microsoft Windows XP, Vista, Windows 7, and 8 (32 or 64 bit).
MICROLINK SOFTWARE FOR THE NHT 310 METER
The software used in conjunction with the NHT 310 meter, provides the remote management of the meter via optical fiber on PC through Optical/USB converter. The software is direct and intuitive. It graphically displays the amplitude/time output and reproduces the user interface in real time. Complete with keyboard and graphic display, and provides the table with all the data related to monitoring.
The data measured via single or multiple monitoring are listed in a table providing the following information
- Date/Time
- Axis X, Y, Z
- ISO value
- AVG value
- MAX value
- Temperature
- Type of Probe (clicking on the specific field opens a window with data from the corresponding probe).
- GPS Lock/Off
- GPS coordinates
In the amplitude/time mode pan, zoom, min and max functions are available, and the operator can select linear or logarithmic scale. The graph allows the display of each single axis, the resulting, of the mean and temperature value. Additional software functions: Data export Alarm threshold setting (buzzer) Moving average sample rate Sample rate and programmed start of the monitoring Date and time setting
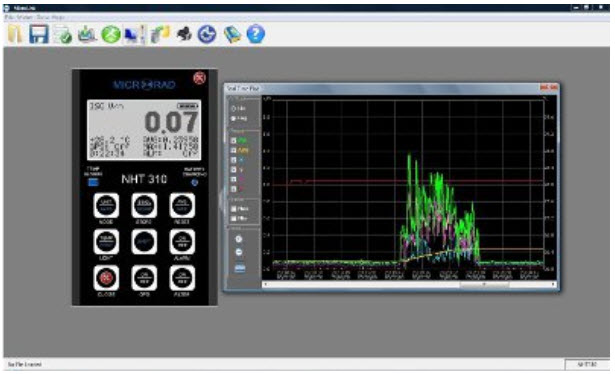
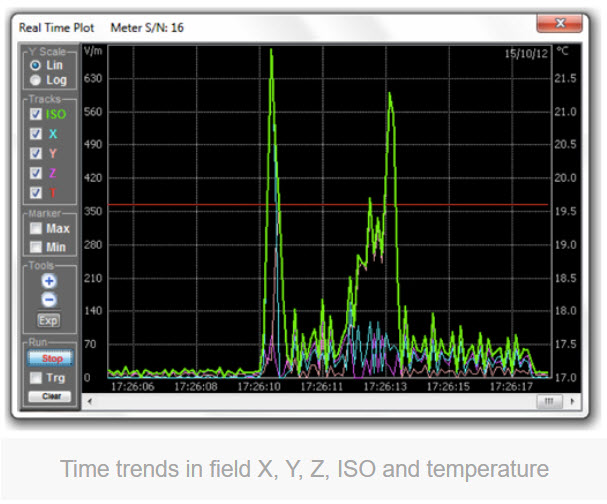
EMC VIEWER SOFTWARE DISPLAYS DATA FROM 8 SENSORS SIMULTANEOUSLY
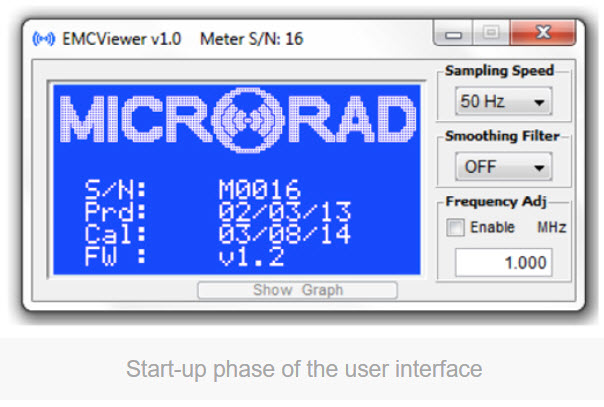
The EMC Viewer allows the user to connect to a virtually unlimited number of sensors (currently configured for up to 8 sensors simultaneously). The software is simple and intuitive, it displays the current values and trends time/frequency allowing to export data and images.
Displayed information:
- Unit of Measure of the Field (selectable sequence: V/m, A/m, Wm2, mW/cm2)
- Indicator of the level of battery charge, percentage and graph
- Actual value of measured field
- Maximum value of the measured field
- Temperature (°C)
- Value of the field measured on each axis X, Y, Z
- Selectable filters
- Selectable correction factors in the frequency domain
Other functions:
- Data and images export
- Trigger threshold level of acquisition
- Zoom
- Amplitude/Time Marker
- Start/Stop Acquisition
• Exp button allows the operator to export as an image file of the graph currently displayed, or export the data in Excel format.